
That all sounds well and good but, how exactly do intelligent dashboards for oil and gas companies impact your bottom line? How exactly can this type of system help your business save money? We are going to take a look at how PetroBase Pro’s oil and gas intelligent dashboards can help you an
Proactivity in Identifying and Preventing Lost Production to Save on Costs
Digitization is greatly affecting all areas of the oil and gas production process. Digital dashboards are especially useful in the field because they allow field personnel to be more proactive in identifying lost production. The PetroBase production dashboard is a browser-based production surveillance tool that can be used on a computer and mobile devices in the field or on the go.
Economic consequences occur when production is lost to downtime. Expenses are incurred today to produce nothing or a fraction of the production stream. More times than not production will not be recaptured tomorrow, but will be produced years later with additional cost and discounted returns. When environmental and/or operational influences come into play, we can see where production has significant spikes or sharp declines – these spikes and declines can easily be monitored on a dashboard.
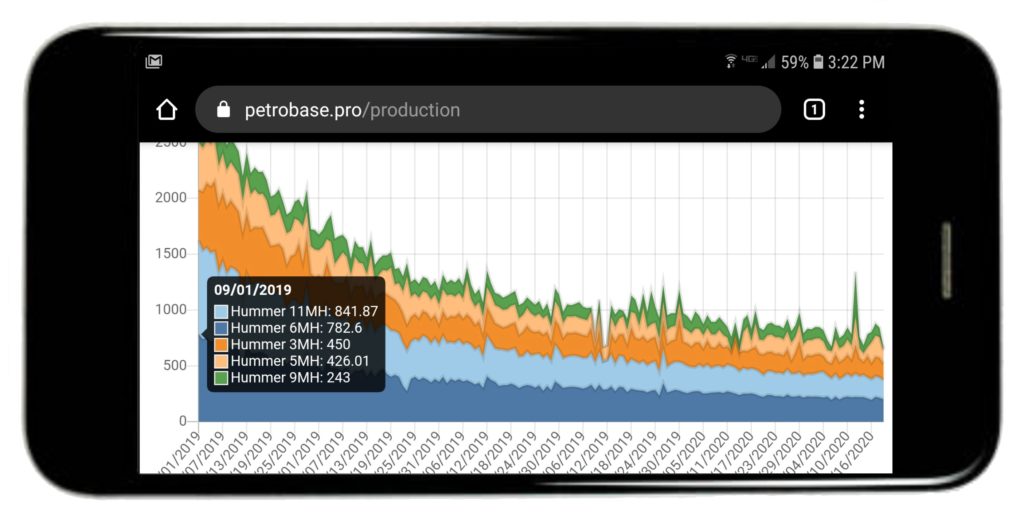
Essentially, the dashboard gives field operators and personnel a single platform where they can visualize what is occurring so they can take action and combat lost production.
Directing Attention to Analysis with an Accurate Lifting Cost Dashboard
In addition to the production dashboard, the lifting cost dashboard is where a user can start to visually compare different cost metrics across their entire organization. You don’t have to be skilled at generating lifting costs to begin to find differences throughout your operations that may be costing excess money.
This dashboard helps easily build a list of specific action items based on the data collected and analysis performed within the PetroBase data management system.
Think of it this way: If a user is not slowed down by the complications of having to perform thousands of calculations to obtain the complete picture of a company’s lifting cost, they will have more energy to look at the end result and potentially identify where money is being lost.
The idea with both the production and lifting cost dashboard is to direct attention to the analysis of the data and the output of data rather than having to produce the analysis on their own.
Reduce Redundancies and Easily Review Analytical Data
Your oil and gas data management system and dashboard should ultimately allow you to increase productivity, reduce redundancies, and save money. The PetroBase Pro data management system removes the inefficiency of having multiple people handle the same piece of data or spend significant amounts of time searching for the data they need. Spreadsheets are wonderful, but they become stale the moment they are closed.
You don’t have to be an engineer, mathematician, or rocket scientist to use PetroBase Pro. Our system delivers analytical data in a clear and concise view that is easy to grasp so you can understand what is happening with your operations from a lifting cost and production standpoint.
A simplified view of the datasets with easily digestible charts, graphs, tables, can help you find the pieces of data that are abnormal and possibly affecting your costs.
A Real-World Example of Cost Savings with PetroBase Pro
An operator using the PetroBase Pro system recognized a grossly large demulsifier cost per barrel of oil on their lifting cost dashboard. They were able to quickly analyze the situation and take corrective action. That action was able to instantly save 24-30,000 actual dollars being spent annually back into the company from a single lease.
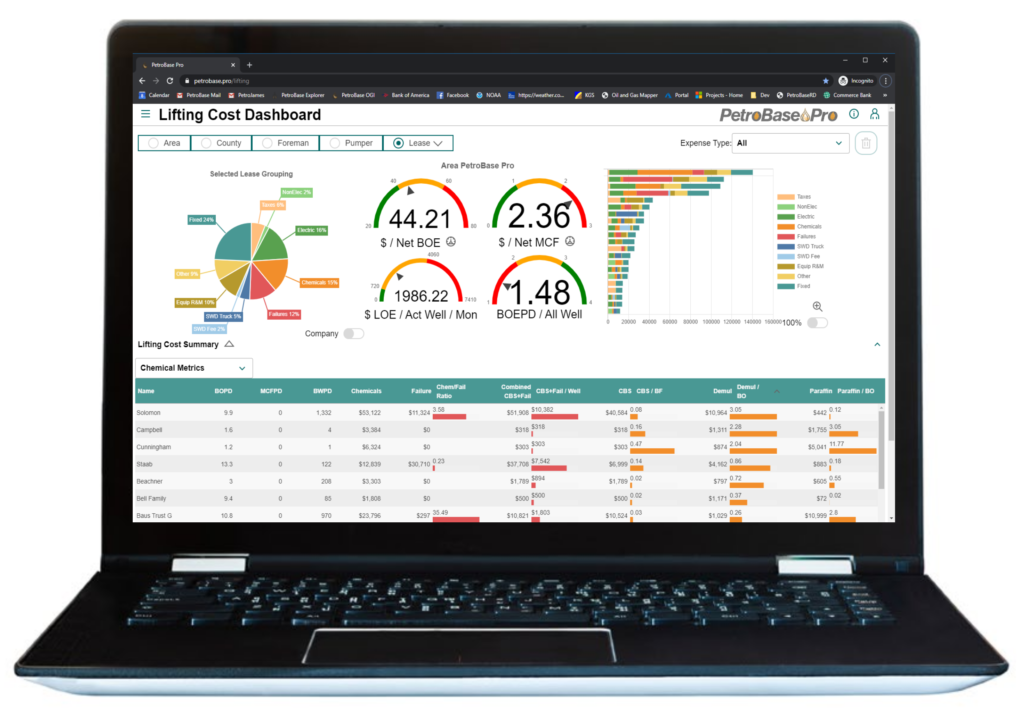
The image above shows where an operator could be spending more than the average on demulsifier. All metrics within the lifting cost dashboard can be sorted this way quickly pointing out glaring problems.
The demulsifier was the initial problem, but further analysis also identified that corrosion inhibitors were also a major concern. This was a direct result of a continuous chemical pump that had been left unchecked for a significant period of time.
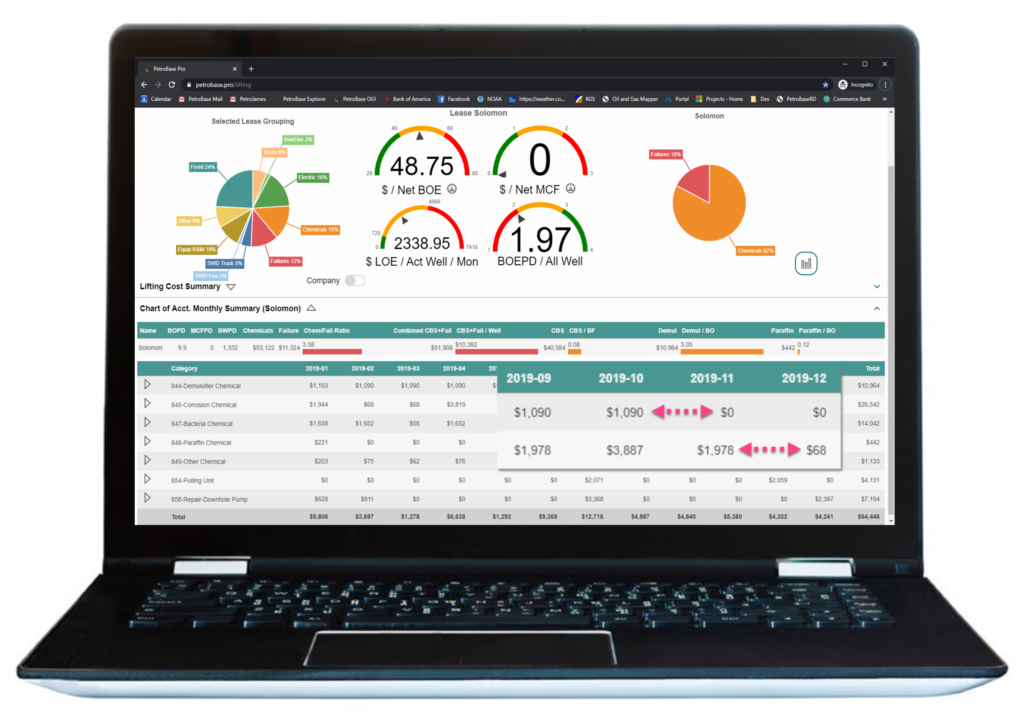
The image above shows the line item expense that was loaded into PetroBase Pro on the use case with the demulsifier problem. The highlighted section shows the two months before they started using PetroBase Pro and the two months after.
Oversights like this occur time and time again and often are not caught until years have passed and significant amounts of money has been lost.
In the example above, the savings alone paid for PetroBase Pro and ensured that future oversights like this are not left unchecked.
Click below to find out more about the capabilities and features of PetroBase Pro!
Get the PetroBase Pro Capabilities Overview
Find out more about the capabiltites and features of PetroBase Pro, and how our software can integrate all of your oil and gas data into one application!