
PetroBase Explorer Google Maps Integration
Visualize production and well data with PetroBase Explorer’s Google Maps Integration. Identify trends, patterns, and anomalies with a variety of mapping layers. Select a well to view completion information, production, and well files in pop-up cards and detail panel.
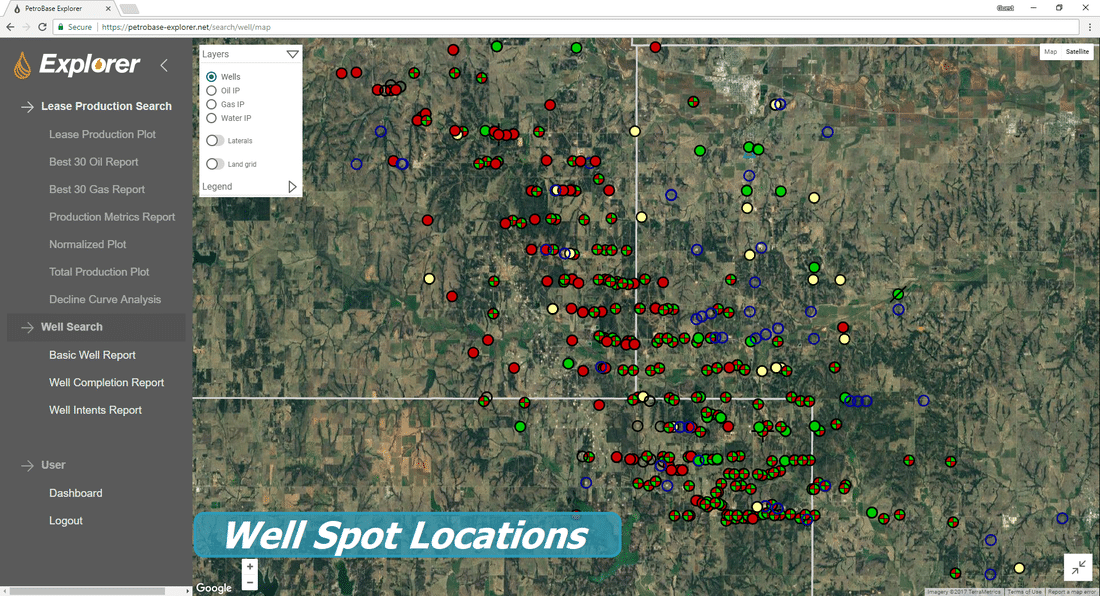
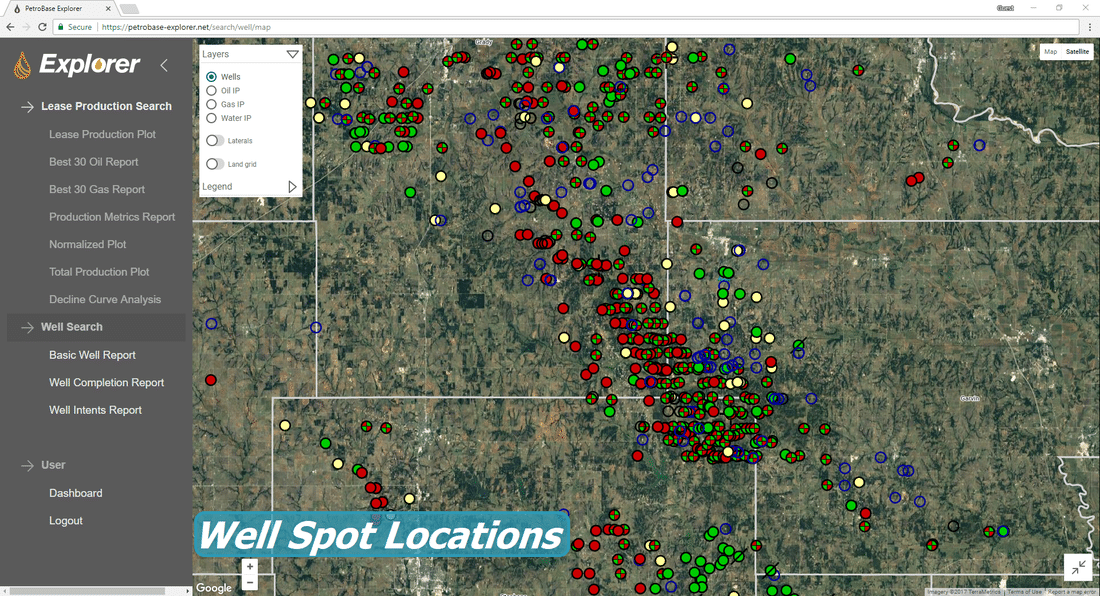
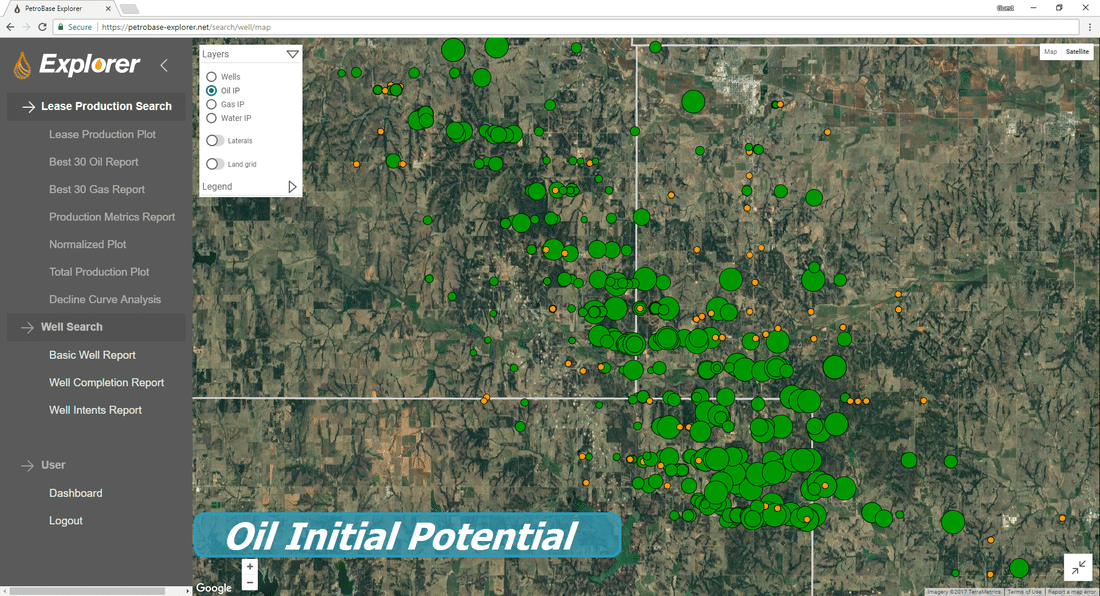
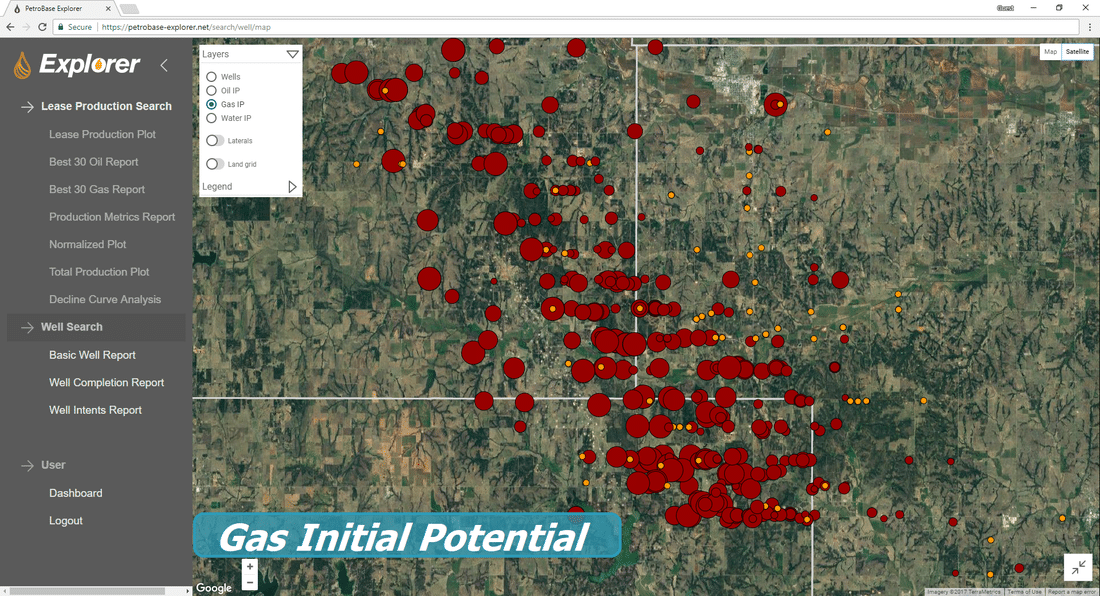
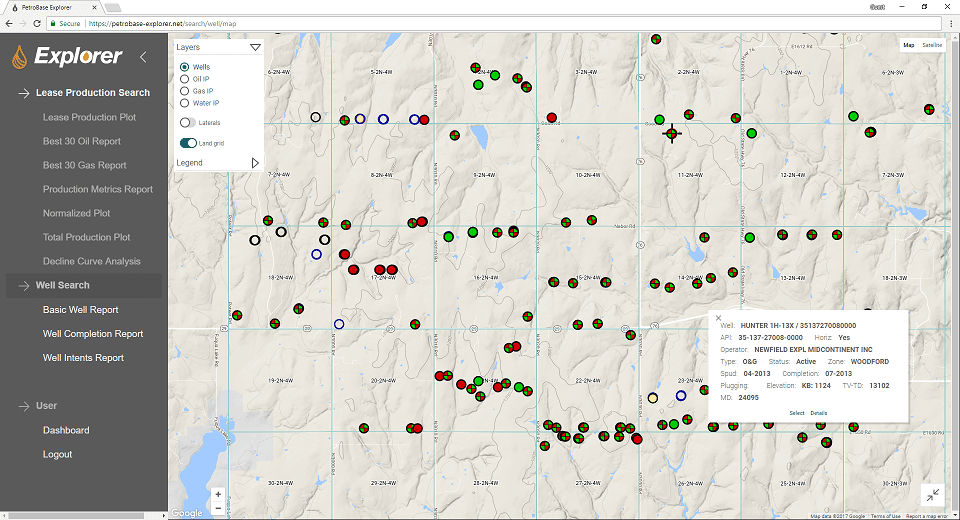
Well Map Layers
Toggle through different well layers to view initial potentials and horizontal laterals.
- Well Spot Locations
- BOE Initial Potential
- Oil Initial Potential
- Gas Initial Potential
- Water Initial Potential
- Percent Oil or GOR

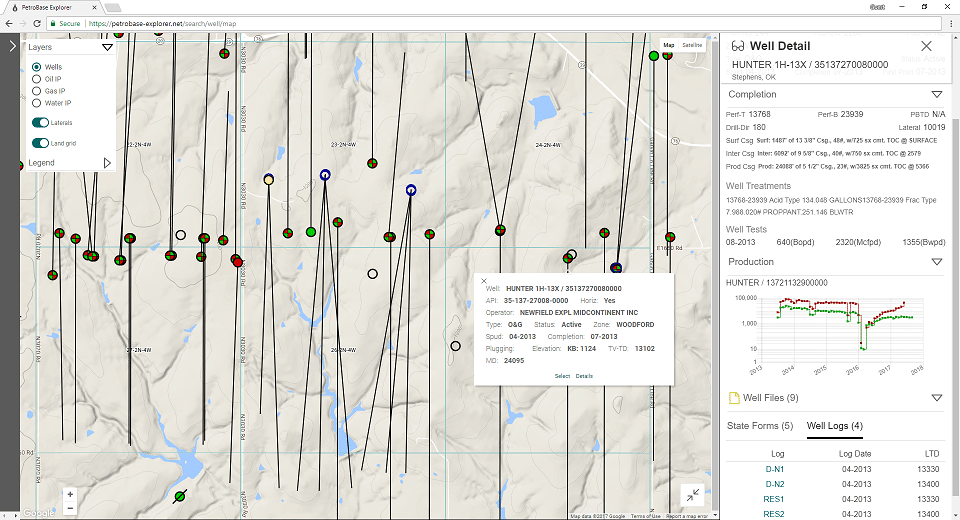
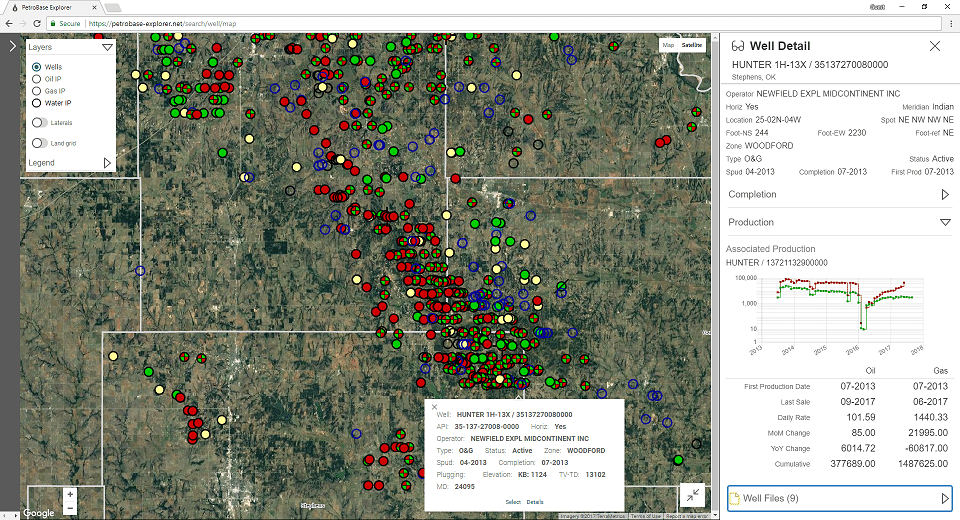
Well & Production Detail
Research well completions, production and well files in pop-up well cards and the detail panel.

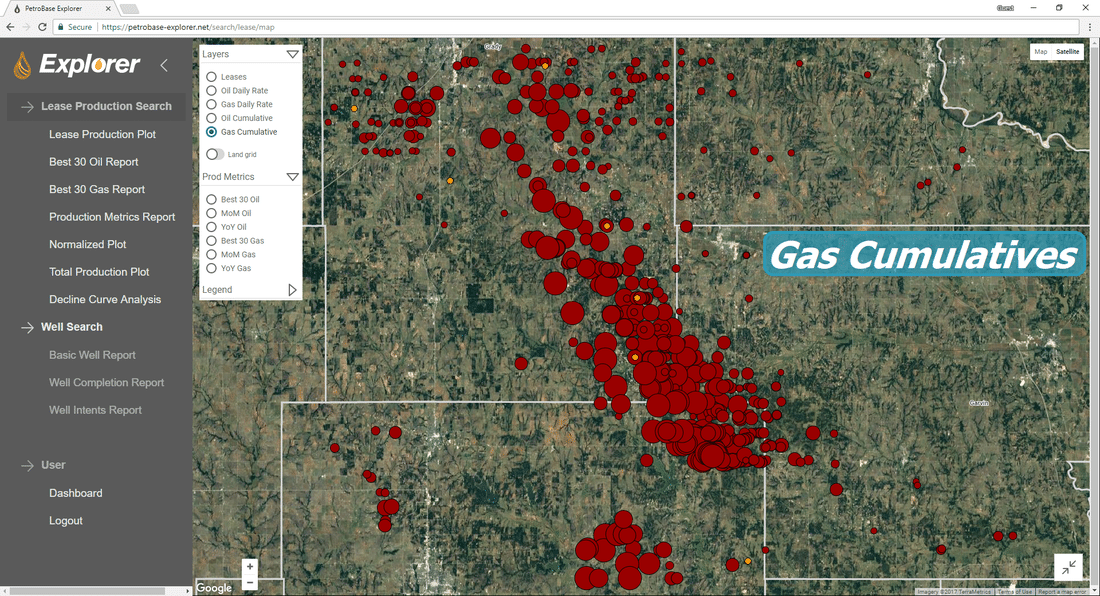
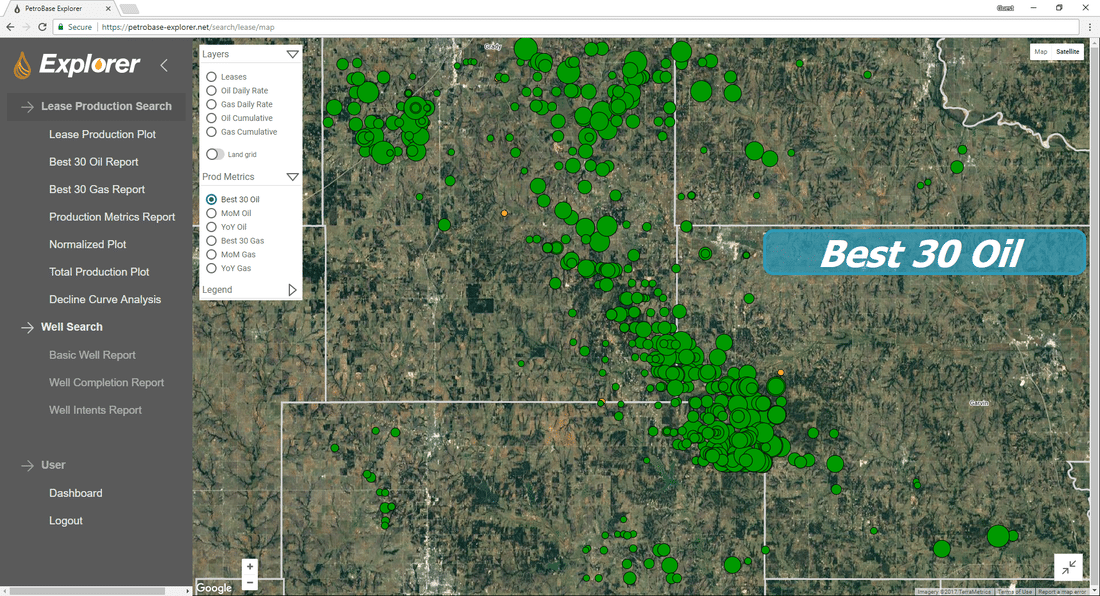
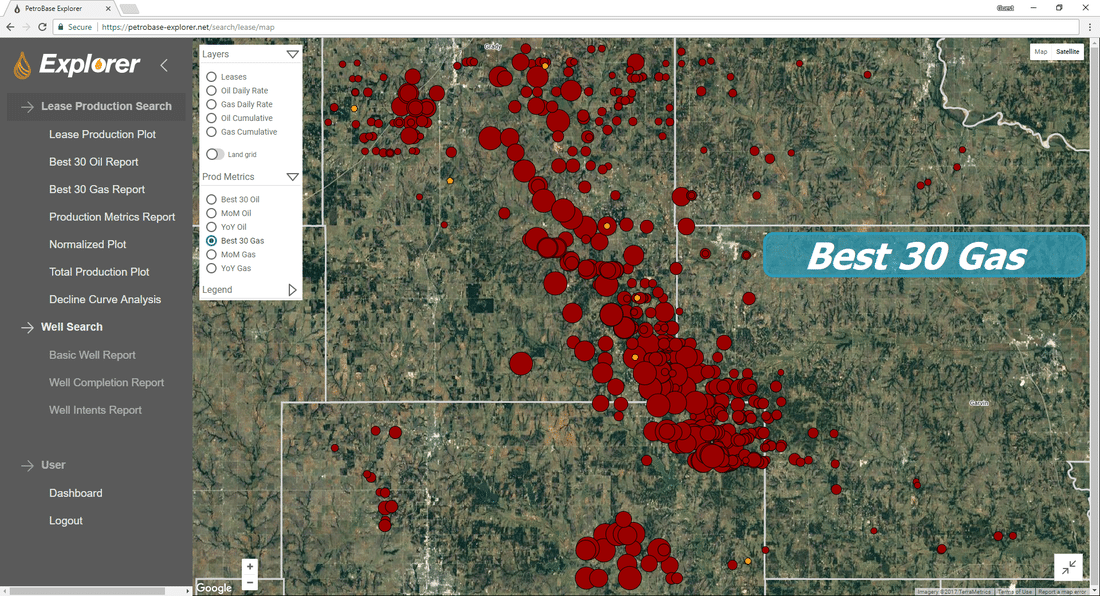
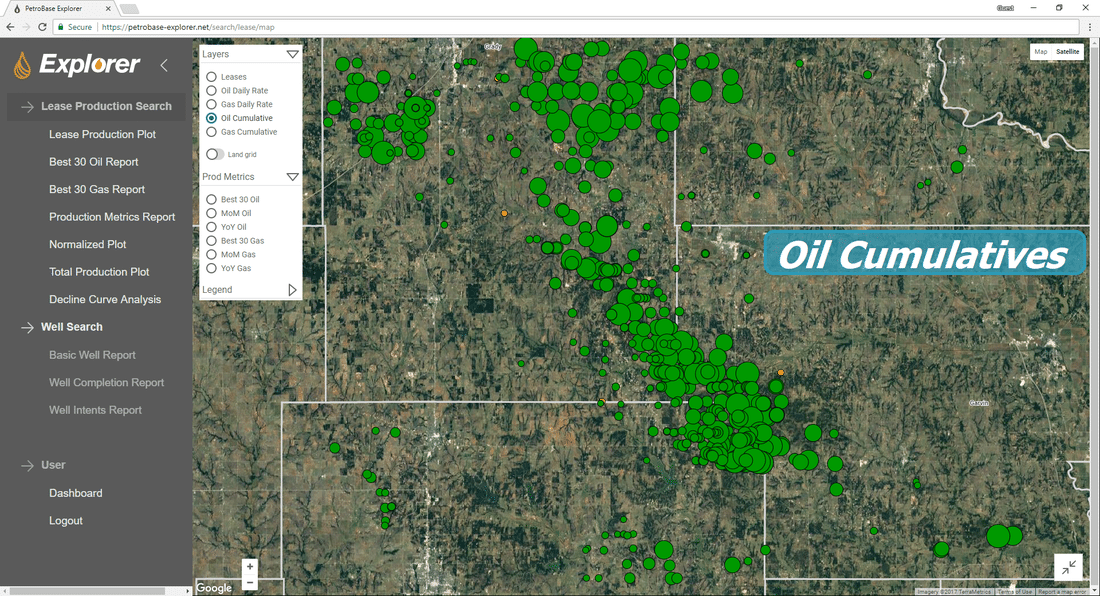
Production Map Layers
Identify oil and gas production trends instantly with production layers.
- BOE, Oil and Gas Daily Rates
- BOE, Oil and Gas Cumulatives
- BOE, Oil and Gas Best 30s
- Operator Halos
- Production Changes by Month or Year
All data is derived from third party public sources. The accuracy of data cannot be guaranteed. Any person or entity that relies on any information obtained from PetroBase, LLC does so at their own risk.
PetroBase will continue to grow and work diligently to remain a reliable source for oilfield software and data solutions.